
Description
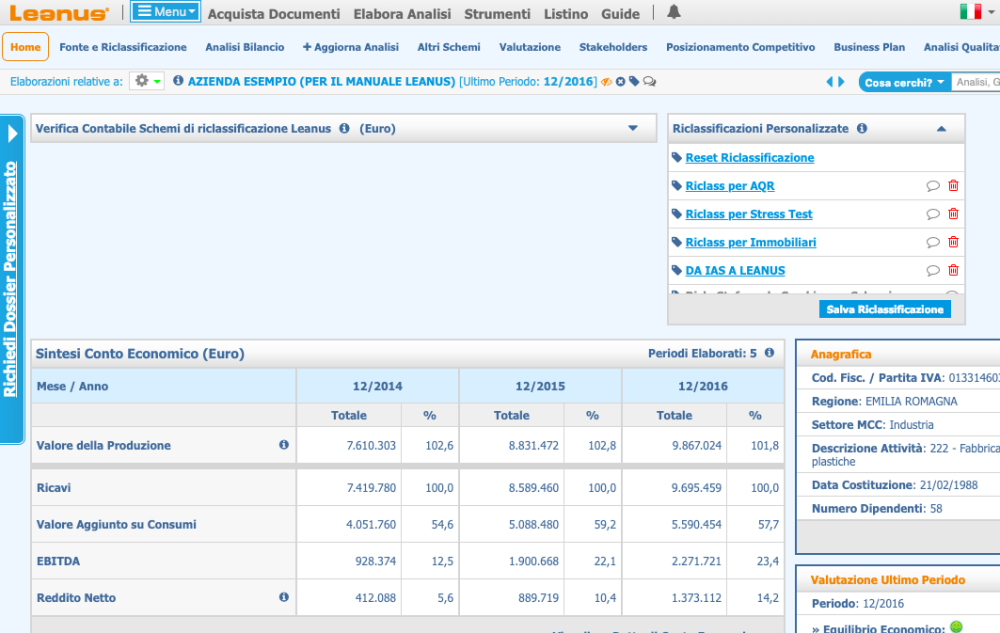
Page HOME it provides a general overview of the company's situation and allows for in-depth analysis of both personal and accounting information. In addition, the information boxes on the right provide information, suggestions, evaluations and analyzes that allow you to optimize the time needed to understand the company's situation.

Procedure
![]() Log in to Leanus
Log in to Leanus
![]() Make research analysis
Make research analysis
![]() Click on the menu Home (first on the left), the Home menu usually opens automatically.
Click on the menu Home (first on the left), the Home menu usually opens automatically.
Video pills
(updating)
Dedicated Webinars
![]() Leanus – that's why you save time
Leanus – that's why you save time
Useful Tips
![]() Leanus analyzes include 5 years and more. On the Home page you can view the last 3 years
Leanus analyzes include 5 years and more. On the Home page you can view the last 3 years
![]() The "Read more" button located at the bottom of the Income Statement, Balance Sheet, Cash Flow Statement and Ratio tables allows direct access to the complete analysis. The same menus can be reached via the Financial Statement Analysis Menu
The "Read more" button located at the bottom of the Income Statement, Balance Sheet, Cash Flow Statement and Ratio tables allows direct access to the complete analysis. The same menus can be reached via the Financial Statement Analysis Menu
![]() The Quadrature Control Box, the red symbols and the information contained in the information boxes allow you to analyze every aspect of the company. The Learn More buttons direct you to the Menu where you can go in depth
The Quadrature Control Box, the red symbols and the information contained in the information boxes allow you to analyze every aspect of the company. The Learn More buttons direct you to the Menu where you can go in depth
![]() The icons placed to the right of the name allow you to obtain useful information (e.g. presence of the Consolidated, Negative News, etc.)
The icons placed to the right of the name allow you to obtain useful information (e.g. presence of the Consolidated, Negative News, etc.)
Insights
On the right there is a list of information boxes from which it is possible to obtain all useful information. Below are some examples
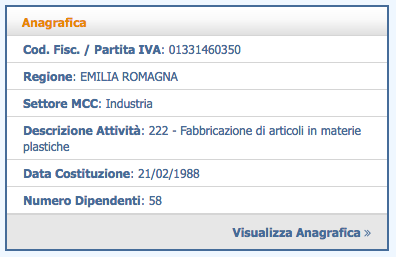
Registry Box
The quadrant shows the main personal information available for the company
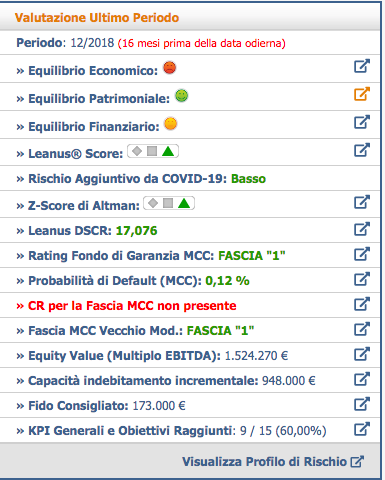
Last Period Evaluation
The quadrant allows you to view the summary evaluation of the accounting data relating to the last period through commonly used and proprietary scores and algorithms. The Additional Risk from Covid 19 which can take on values Low, Medium, High evaluates the additional risk deriving from a sudden reduction in activity and the related effects on the Economic, Equity and Financial profile. The indicator takes into account the Ateco code, the capacity to absorb losses, the break-even values, the relative safety margins and the Leanus Score. To carry out the necessary "stress tests" it is recommended to use the Business Plan module.
Last Period Attention Points Box
The quadrant highlights the most relevant information relating to the last accounting period available

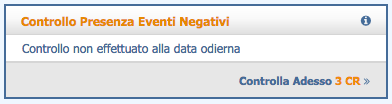
Check for negative events
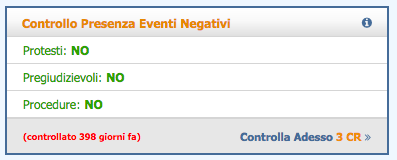
The quadrant, positioned below the one relating to personal data, allows you to check in real time the possible presence of Protests, Prejudicial, Procedures against the company present in an archive managed by a primary service provider Business Information.
For each type the user gets:
- a positive feedback SI in the presence of Negative Events;
- a negative feedback DO NOT in the absence of Negative events;
- a neutral response N/A in case the answer is not available.
The option can be activated by the user by pressing on the writing located at the bottom right of the mask. The cost of the service is indicated in Credits (1 Euro = 1 Credit).
To obtain the details of the events and / or carry out a real-time verification of the presence of Protests or Procedures in the Official Registers, the user must access the menu.
Box Download (accounting data and analysis available)
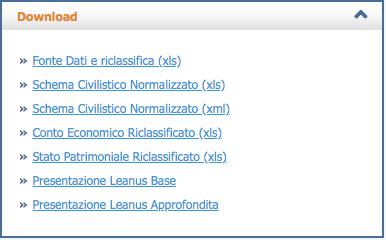
The next box presents the possibility for the user to:
• download the financial statement input data in Excel together with the indications for the management reclassification;
• download the reclassified Value Added Income Statement in Excel. The main indicators calculated by Leanus and the verification of the balancing control are present;
• download the Balance Sheet in Excel. There are also the main indicators calculated by Leanus and the verification of the balancing control;
- download the normalized statutory scheme in Excel
- download in XML the normalized statutory scheme (the XML can be reloaded on Leanus for further processing)
• elaborate the slides relating to the Basic Analysis showing the main personal data and a summary of the company evaluation (Executive Summary);
• elaborate the slides relating to the In-Depth Analysis which, compared to the basic one, contain additional information such as the calculation of KPI, the Leanus score and the Altman Z-Score, the Break Even Point, the recommended credit line and the maximum sustainable debt.
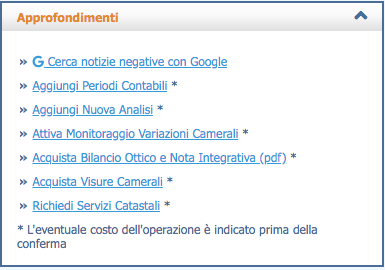
Insights Box
The last box contains further indicators, such as:
- Search for negative news with Google
• Add Accounting Periods (upload new annuities or update existing ones) - Create a new analysis
- Activate Chamber Change Monitoring
- Purchase the Optical Balance.
- Purchase Chamber of Commerce Certificates
- Requires cadastral surveys
![]() From the home page, you can manage your customized reclassification models to assess the impact of different reclassification models
From the home page, you can manage your customized reclassification models to assess the impact of different reclassification models
Complete list
![]() Automatic Report
Automatic Report
![]() Personal data
Personal data
![]() Local units
Local units
![]() Eco / Fin synthesis
Eco / Fin synthesis
![]() Last Period Evaluation
Last Period Evaluation
![]() KPI Sectors and Crisis Code
KPI Sectors and Crisis Code
![]() So
So
![]() Wedding invitations
Wedding invitations
![]() Effective Owners
Effective Owners
![]() Exponents and Offices
Exponents and Offices
![]() Negative Events
Negative Events
Quick Download
![]() Excel Reports
Excel Reports
![]() XML Prospectuses
XML Prospectuses
![]() Presentations
Presentations
![]() ...
...
Other Insights
![]() News
News
![]() Chamber data (it will not be necessary to type the search criteria)
Chamber data (it will not be necessary to type the search criteria)
![]() Cadastral data (it will not be necessary to type the search criteria)
Cadastral data (it will not be necessary to type the search criteria)
![]() Monitors (you won't need to type your search criteria)
Monitors (you won't need to type your search criteria)
![]() ....
....
Controls and Other Functions
![]() Display the balancing controls
Display the balancing controls
![]() Call up the different custom reclassification templates
Call up the different custom reclassification templates
![]() Download the Supplementary Notes
Download the Supplementary Notes
![]() Transfer toAREA CONFIDENTIAL
Transfer toAREA CONFIDENTIAL
![]() ...
...
_________________________________________________________________________


Post your feedback on this topic.