
Description
The Leanus Group Analysis module allows you to analyze the balance sheet performance of a set of companies selected using filters (or loading of CFs) and to evaluate its economic, equity and financial profile both at an aggregate level and for each individual company. The module responds to all the needs of those who need to analyze portfolios of customers, suppliers, competitors or market segments, to carry out monitoring activities or to analyze portfolios for the purpose of selling or purchasing non-performing loans , securitisations, etc. For specific and highly sophisticated needs, the “Portfolio Management” module is available for Corporate users only.
Procedure
![]() In AREA PUBLISH, if applicable, go to Process Analysis / Filter Master Data
In AREA PUBLISH, if applicable, go to Process Analysis / Filter Master Data
![]() Set i filters for Search and click on "Apply Filter"
Set i filters for Search and click on "Apply Filter"
![]() To add new filters, click on "Add Filter"
To add new filters, click on "Add Filter"
To Create the Group:
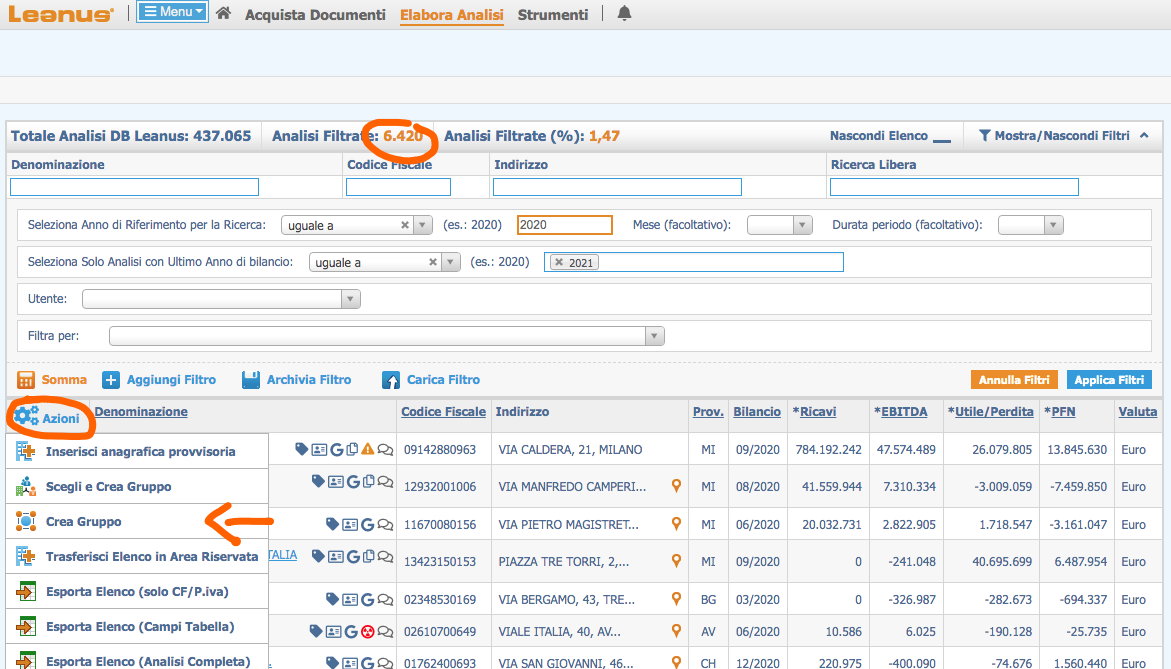
![]() Click on Actions, located at the top left of the "Name" field in the header of the table
Click on Actions, located at the top left of the "Name" field in the header of the table
![]() Click on Create Group
Click on Create Group
![]() Type the name you want to associate with the group
Type the name you want to associate with the group
For the various aggregation procedures, view the sections of this manual dedicated to Group analysis.
Practical Tips
To make the most of the Group Analysis module, it is important to follow a few recommendations:
- Set the filters that you think meet your needs. Create the group and analyze the results via the Commented Report or the Group Analysis Menu
- The analysis will highlight cases that you may not have considered. Use the "edit group" function to refine your selection.
- Consider special cases: presence of ordinary and consolidated financial statements, abbreviated financial statements, financial statements with several accounting periods for the same year. The Anomaly List Menu can guide you in your choices
By following these recommendations, it will be possible to make the best use of the Leanus Group Analysis module and obtain accurate and reliable results.
Video pills
![]() With Leanus you can create business groups and evaluate their economic, asset and financial profile
With Leanus you can create business groups and evaluate their economic, asset and financial profile
![]() Sector studies and portfolio analysis: handle with great care!
Sector studies and portfolio analysis: handle with great care!
![]() How to analyze a market segment with Leanus
How to analyze a market segment with Leanus
Dedicated Webinars
![]() Portfolio analysis and mistakes to avoid
Portfolio analysis and mistakes to avoid
Research on Leanus in the section
Insights
![]() Download an example of the Leanus Automatic Report
Download an example of the Leanus Automatic Report

What are the methods of aggregation (Creating Groups)?
It is possible to select the companies by name (Procedure Menu Process Analysis / "Create New Group" is select companies using filters
Is it possible to select the consolidation percentage?
Yes. During the Group Creation procedure it is possible to modify the Consolidation percentage. The default value is 100
What filters are available?
You have dozens of filters that you can use by combining them according to your needs
![]() Research Reference Year . In the case of research on accounting period data (Eg Revenues> 100), the indicated year will be the reference year. If not indicated, Leanus will search for any available year
Research Reference Year . In the case of research on accounting period data (Eg Revenues> 100), the indicated year will be the reference year. If not indicated, Leanus will search for any available year
![]() Only Analysis with Last Financial Year . It allows you to identify the companies that have the one indicated as their last available financial year
Only Analysis with Last Financial Year . It allows you to identify the companies that have the one indicated as their last available financial year
![]() Generali. They allow you to identify general characteristics of the individual master data (e.g. balancing accounting periods, number of periods, etc.)
Generali. They allow you to identify general characteristics of the individual master data (e.g. balancing accounting periods, number of periods, etc.)
![]() Personal data (eg. Municipality, POSTAL CODE, Province, Legal Status, Nace, DIH, RAE etc.)
Personal data (eg. Municipality, POSTAL CODE, Province, Legal Status, Nace, DIH, RAE etc.)
![]() Income Statement
Income Statement
![]() Balance Sheet
Balance Sheet
![]() Financial statement
Financial statement
![]() Balance Sheet Indices
Balance Sheet Indices
![]() Only Analysis with Last Financial Year
Only Analysis with Last Financial Year
![]() KPI Crisis Code
KPI Crisis Code
![]() Custom fields
Custom fields
For the list of available filters see the section Search with Filters of the Manual
Is it possible to modify a previously created group?
Yes.
Access the Group and click on Edit Group located in the "Group Analysis" menu or in the multifunction wheel located to the left of the name
The list of companies already included in the group will be displayed.
To add new businesses to the group
![]() enter your name or tax code in the appropriate field
enter your name or tax code in the appropriate field
![]() click on the plus
click on the plus
To modify the selection by modifying the filters
![]() Click on Filter Analysis at the top right
Click on Filter Analysis at the top right
At the end of the selection, click on Actions and Create a new group
The previously created group cannot be changed. Instead, it is possible to create a new one with the new criteria.
The groups can be deleted by clicking on the multifunction wheel located to the left of the group name
Is it possible to benchmark between groups or create a group of groups?
YES. in the same way with which the benchmark is carried out between two or more companies (Benchmark Menu)
What is the best practice to make the most of filter search?
![]()
![]() Select thereference year and click on "Apply Filters"
Select thereference year and click on "Apply Filters"
![]()
![]() Decide whether to include the month of the end of the financial year and the duration of the period then click on "Apply Filters"
Decide whether to include the month of the end of the financial year and the duration of the period then click on "Apply Filters"
![]()
![]() Use the filter block Generali to choose the type of business you want to include (Ex. Ordinary, Consolidated, Complete Financial Statements, number of periods processed then click on "Apply Filters"
Use the filter block Generali to choose the type of business you want to include (Ex. Ordinary, Consolidated, Complete Financial Statements, number of periods processed then click on "Apply Filters"
![]()
![]() Select the Geographical areas of your interest and then "Apply Filters"
Select the Geographical areas of your interest and then "Apply Filters"
![]()
![]() Select the Business model (Service, Traditional, Trader) and the Type of Production (Warehouse, Job Order) and then "Apply Filters"
Select the Business model (Service, Traditional, Trader) and the Type of Production (Warehouse, Job Order) and then "Apply Filters"
![]()
![]() Insert the dimensional criteria or other target parameters (e.g. Revenues greater than ..., Pfn/ EBITDA lower than and then "Apply Filters"
Insert the dimensional criteria or other target parameters (e.g. Revenues greater than ..., Pfn/ EBITDA lower than and then "Apply Filters"
![]()
![]() Archive Filters so you can retrieve them later
Archive Filters so you can retrieve them later
![]()
![]() Create the Group and analyze the Commented Report to evaluate if the companies match your search criteria (e.g. average collection, payment, warehouse rotation times)
Create the Group and analyze the Commented Report to evaluate if the companies match your search criteria (e.g. average collection, payment, warehouse rotation times)
![]()
![]() View the analysis of the Nace and other sectoral codes to identify categories to exclude
View the analysis of the Nace and other sectoral codes to identify categories to exclude
![]()
![]() Create the Group from the Menu "Actions .." and label it “long list or temp” or other labels that indicate that this is a temporary selection
Create the Group from the Menu "Actions .." and label it “long list or temp” or other labels that indicate that this is a temporary selection
![]()
![]() Analyze the group from the Menu Group Analysis to identify further selection criteria
Analyze the group from the Menu Group Analysis to identify further selection criteria
![]()
![]() Edit the Group (rotate to the left of the Denomination) and Filter the companies using the additional criteria
Edit the Group (rotate to the left of the Denomination) and Filter the companies using the additional criteria
![]()
![]() Repeat the operation from STEP 10 onwards until the desired group is reached
Repeat the operation from STEP 10 onwards until the desired group is reached
Is it possible to create Groups of Groups?
Yes. Access the Group List from the Edit Analysis Menu and repeat the operations described for the procedure for creating enterprise groups
Is it possible to create a commented report of the Groups analysis?
Yes. From the Presentations Menu or the Group Home page
What are the main analyzes in the Group Analysis menu?
![]()
![]() Summary of aggregate data (Revenues, Marginality, GDP, Debt, Leanus Score, etc)
Summary of aggregate data (Revenues, Marginality, GDP, Debt, Leanus Score, etc)
![]()
![]() Statistics (by Risk profile, by Nace, Sector, Year of Incorporation, main accounting items, Analysis of concentration and dispersion in both graphic and tabular form, Mean, Median and Standard Deviation)
Statistics (by Risk profile, by Nace, Sector, Year of Incorporation, main accounting items, Analysis of concentration and dispersion in both graphic and tabular form, Mean, Median and Standard Deviation)
![]()
![]() Strategic matrices (Identification STAR, STUCKS, RUNNERS, stable, etc)
Strategic matrices (Identification STAR, STUCKS, RUNNERS, stable, etc)
![]()
![]() Rankings (By Revenue, EBITDA, Net income, Pfn, ...)
Rankings (By Revenue, EBITDA, Net income, Pfn, ...)
![]()
![]() Category Analysis (STAR, STUCKS, RUNNERS, stable)
Category Analysis (STAR, STUCKS, RUNNERS, stable)
![]()
![]() Distribution for Nace, Codes CDC, SAE, RAE, DIH
Distribution for Nace, Codes CDC, SAE, RAE, DIH
![]()
![]() Distribution by Type of Production (Warehouse, Order), Business Model (Services, Traders, Industrials)
Distribution by Type of Production (Warehouse, Order), Business Model (Services, Traders, Industrials)
![]()
![]() Distribution by Leanus Score
Distribution by Leanus Score
It is also possible view the list of companies included in the group, modify the group * by applying additional selection criteria * and much more.
__________________________________________________________________________________________
(video tutorial: available soon)
View webinars dedicated to group analysis on www.leanus.it/webinar
_________________________________________________________________________


Post your feedback on this topic.